May 29, 2023
Crafting custom reporting dashboards for clear communication and impactful project insights

Whatever role you play in your company, you need to know things. If you sit in the C suite, you need to keep project delays that impact customers on your radar. And when you are thinking of launching a new initiative, you must first assess your available resources. The finance people need to know when blips in projects impact the budget. A project manager requires constant status updates on every team member’s progress. Even contractors and customers have questions they need to get answered.
How does everyone – from the CEO to the customers – get the information they need in your company? In many organizations, the answer to this is complicated and different for each role. It could involve asking the project manager for a report, making phone calls, or pulling teams into meetings to get status updates.
If your company is working in Moovila’s Perfect Project or Activate, though, the answer is simple. And it’s the same answer for everyone: Glance at a dashboard, customized for you, that shows you precisely everything you care about – and nothing you don’t.
A view of the information you need
In Moovila’s tools, you can build a personalized dashboard of all the data you care about. Just pick and choose from all the data sets to display an up-to-the-minute view of everything you need to know and are permitted to see.

If you are an executive, overseeing a portfolio of projects, you might build a dashboard that includes one panel showing all the projects with deadlines at risk, another that displays a chart of current staffing expenses, and a graph showing estimated equipment costs.
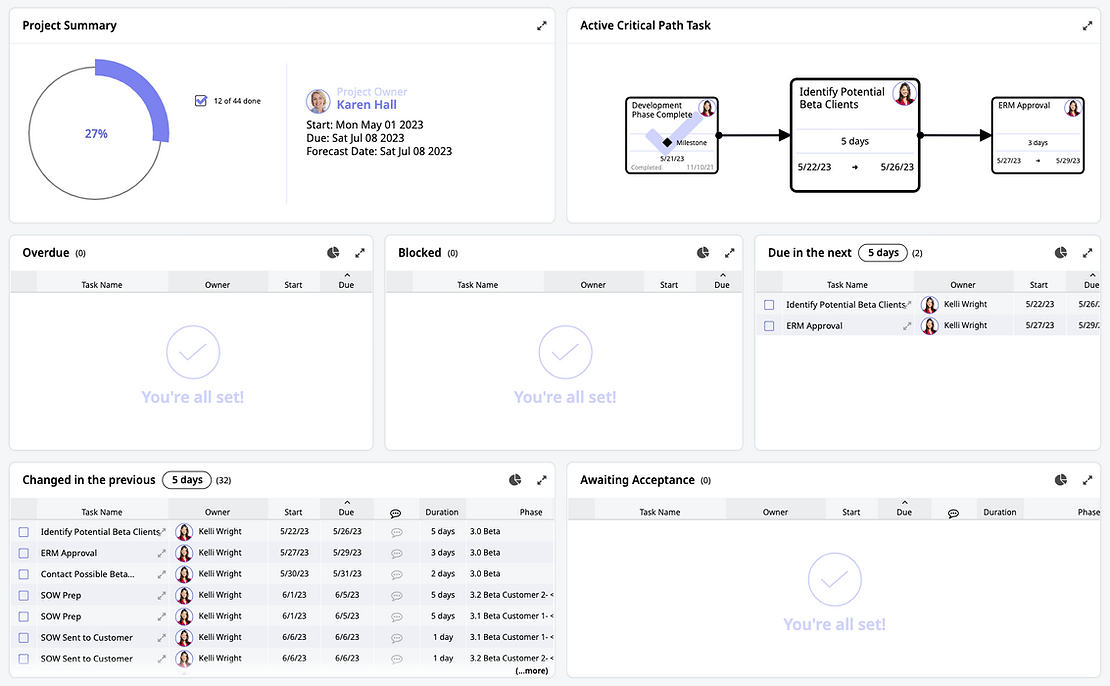
If you are a program manager, your dashboard might display a row of panels that help keep you and your team productive. One panel might display open tasks, another might graph an aggregate chart of your team’s unfinished work, and a third could highlight tasks that are waiting for your acceptance.
If you are managing a project, you could choose to chart all the tasks in the project that are overdue or blocked, tasks that have been completed recently, and who has overdue tasks. You might keep a panel open that flags when team members are overextended or have slack time in their schedule.
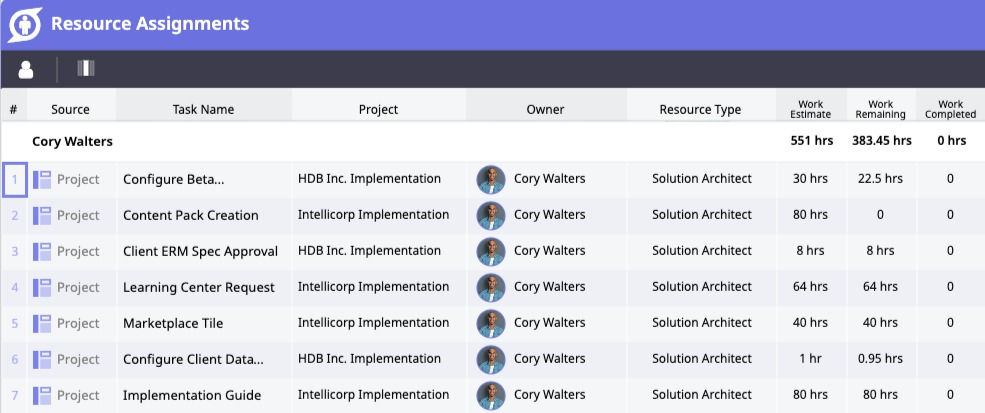
If you are managing resources, you might create a panel showing the work remaining by resource type, and set up growth models to see where you'll need to add staff or reallocate team members to balance work loads.
If you are responsible for the money, you might add a panel to show all the costs associated with the project – or a portfolio of projects – so you know at a glance how projects are flowing from a financial standpoint and when anything threatens to go over budget.
Information at a glance
You can choose to display your personalized data in grids or charts – toggling easily back and forth at will – so that your customized information is visually appealing and conveys the data in the way you best grasp it. These panels make it so easy to stay on top of a project that you may never need to dig deeper into the plan than that.
But you can drill down from any chart or graph to uncover the details because these reports are connected to live data.
Drill down to see why one person, say, has overdue tasks stacking up while another is burning through a similar work pile. Do you have a slacker or is someone in crisis? Maybe that person is on vacation or out sick and you need to reassign that work.
Setting up a personalized dashboard is easy. In fact, there are templates already created so you can choose a preconfigured panel that shows commonly grouped data sets. Just tick some boxes, type in your own descriptions, and watch as the tool pulls in and displays graphs of all the data you want to see. Then drag and drop the panels around your screen to put them in the order you like and toggle to the chart style you prefer.
If you need to know things that aren’t reflected in the prebuilt templates, it’s also easy to customize your own dashboard.
To do this, you simply scroll through a list of available datasets, ticking the ones that interest you. Once the data is in place, tweak the panels into the display order and chart style you want and enjoy.
Once you build a customized dashboard, you can share it as a template so that others in your organization can also use it.
You can also print your dashboard, or share it as a PDF, to create a snapshot in time or to provide a report for someone else.
All the data is filtered by permissions
All the data you choose to add to your panels has already been filtered by the permissions that were set for you by the administrator who invited you to use the software.
This is true for everyone in the company – from executives to contractors to customers.
If you are in the C Suite or accounting, you likely have permission to see sensitive financial data that a program manager would not see. And if you are program manager, you would have access to data that a developer or contractor would not see.
When you pull data into your dashboard – whoever you are – it filters for information that is allowed at your permission level.
These permissions are granular enough to allow everyone from the CEO to contractors, and even customers, to build custom dashboards without fear that confidential information will get to the wrong eyes.
Adding notes to reporting
Dashboards are not only about data. When combined with Notes, they also bring the conversations about work – filtered for you – to your screen.
Everywhere in the project, people can attach written notes to tasks (or at the top project level). Team members can use notes to flag a problem or alert everyone to something that went particularly well. Notes can be used to ask questions and to place warnings.
For example, if a task was challenging, the team member who tackled it could write a brief tale of woe – in a note attached to that task – so that the PM will know to allocate more time or resources to that type of task in the future.
Or if someone went above and beyond, their manager or coworker could write a note right on the appropriate task so that everyone in the project will know who saved the day. Similarly, if someone failed to accomplish a task, a team member could flag the task with a note saying more training was needed or to observe that a particular contractor was not the right call for that job.
These notes show up in your custom reports dashboard with the tasks they are attached to and are filtered by permission level so you can easily leave the contractor or staffer in need of training – or customers – out of the discussion by changing a note’s permission level.
Notes are a powerful tool for gathering information about the workflow and culture of a company or team. You could, for example, add a panel to your dashboard that displayed all the project notes – or those at a certain permission level – to quickly learn how a project went. This is a great way for a high-level manager to quickly catch up with what’s happening in the trenches or for the team to gather data for a project postmortem.
Customized dashboards make staying on top of the work plan – whatever role you play in the company – so easy and efficient that, once you have them, you will wonder how you survived without them.
Ready to take a custom dashboard for a spin? Set up for a demo and see how it works.
Project Management
Product Features