


Project management technology hasn’t really evolved in decades...
1917
The Gantt chart was invented
1940s
The Kanban board made its debut
1957
Critical path was created
1984
MS Project launched for DOS
You are here
2001
Agile Manifesto published
These tools and methods are great for organizing projects, and that’s the reason they’re still in use today. But the processes have barely changed, and, more importantly, the math hasn’t evolved at all.
The factor holding everything back:
PM is too manual.
This is where it gets messy.
No matter how good the tools get at tracking, you’re stuck manually doing the math; shifting resources and teams, fixing capacity conflicts, updating the critical path—all at the last minute.
Then you have to explain why the project was inevitably delayed.
We react to problems because we don’t have a systematic way to address issues before they happen.
Raven Intelligence reviewed 1,300 projects and found that:
38%
of all projects are late
1/2
are late by 2X or more
35%
of projects are over budget
47%
of project teams change
Almost all projects go off track.
Do you want to know, right now, that in 63 days your project will face a major delay? Or do you want to wait 62 days while the issue lays dormant and then scramble with 7 hours of notice?
Do you want to know, right now, that in 63 days your project will face a major delay? Or do you want to wait 62 days while the issue lays dormant and then scramble with 7 hours of notice?
What if we can be more proactive and more predictive?
The upside to this question is MASSIVE!
Betting on small percentages over time yields massive gains.
Imagine what happens to your margins when the 98% of flawed projects are reduced to 88%, to 38%, to 8%.
Think of it this way: In Vegas, the house has a 0.5% edge in black jack, giving players some of the best odds to win. Yet, those same casinos feature singing gold fountains, diamond walkways, and rivers of cash.
Exaggeration? Perhaps, but they’re doing just fine over there.
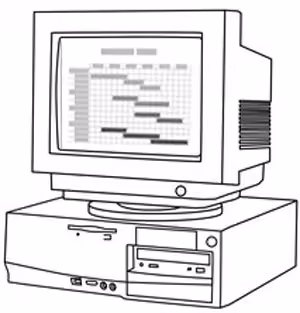
That's hard to do when the tools available today are simply newer versions of MS Project (that, again, launched in 1984), or glorified spreadsheets.
What if there was a way to see how your projects perform, even when you’re away from your desk, so that you don’t have to recheck your plans? It's time to step into 2022...
So, let’s adjust the math... automatically.
Finally, the technology has caught up!

2026
.avif)
Score project health and integrity
.avif)
Identify critical project risk factors
.avif)
Resolve issues with
AI-powered coaching
Welcome to the new era of project management
.avif)
Project health scoring that lets you know where you stand and what’s at risk. Like a credit score for your program, it's an indicator of project health and likelihood of success.
Learn more >.avif)
Risk identification tied to the project score that lets you know where problems lie and alerts you when they arise. Software engineers debug code, why not debug projects?
Learn more >.avif)
AI-powered coaching that walks you through problem resolution, and takes you to the areas that need the most attention. It's as familiar as a software installation wizard, but way smarter.
Learn more >An AI-driven project engine that automatically recalculates every project date for you. Now, we’re talking. This math-driven tool applies project management best practices to your plans behind the scenes for you in real time.
Learn more >.avif)
Resource capacity analysis that shows you all of your employee capacity data in real time so you can balance workloads and maximize margins. At last, you will know with certainty how many resources you need to execute on time, even as projects change.
Learn more >


Automate what you hate
There’s no reason to live in your schedule anymore.
Despite our best efforts to control the project schedule, change is inevitable. What if you can let go with an automated system that keeps you on track, does the math to readjust with change, and alerts you to risks and issues, proactively?
AUTOMATED PLANNING
Set up a safety net. Work with fewer errors.
Create and maintain a dynamic project schedule from planning to execution.
AUTOMATED RISK MANAGEMENT
Monitor and remediate risk 24/7
Don't wait for fires to break out. Moovila monitors projects for risk and alerts you to issues along with guided remediation.
AUTOMATED REPORTING
Create a transparent, single source of truth
Save time and mitigate difficult conversations around status updates, portfolio insights, and value.
AUTOMATED RESOURCE MANAGEMENT
Continually and precisely manage capacity
Balance workloads and identify resource gaps, even as requirements and personal schedules evolve.
Don't have time to watch right now?
Get these videos sent straight to your inbox to view at your leisure.